
2023
MTA Ridership Changes due to Covid-19
Entrant
TWO-N, Inc
Category
Apps & Softwares - COVID-19-Related
Client's Name
TWO-N, Inc
Country / Region
United States
Gallery
About The Entry
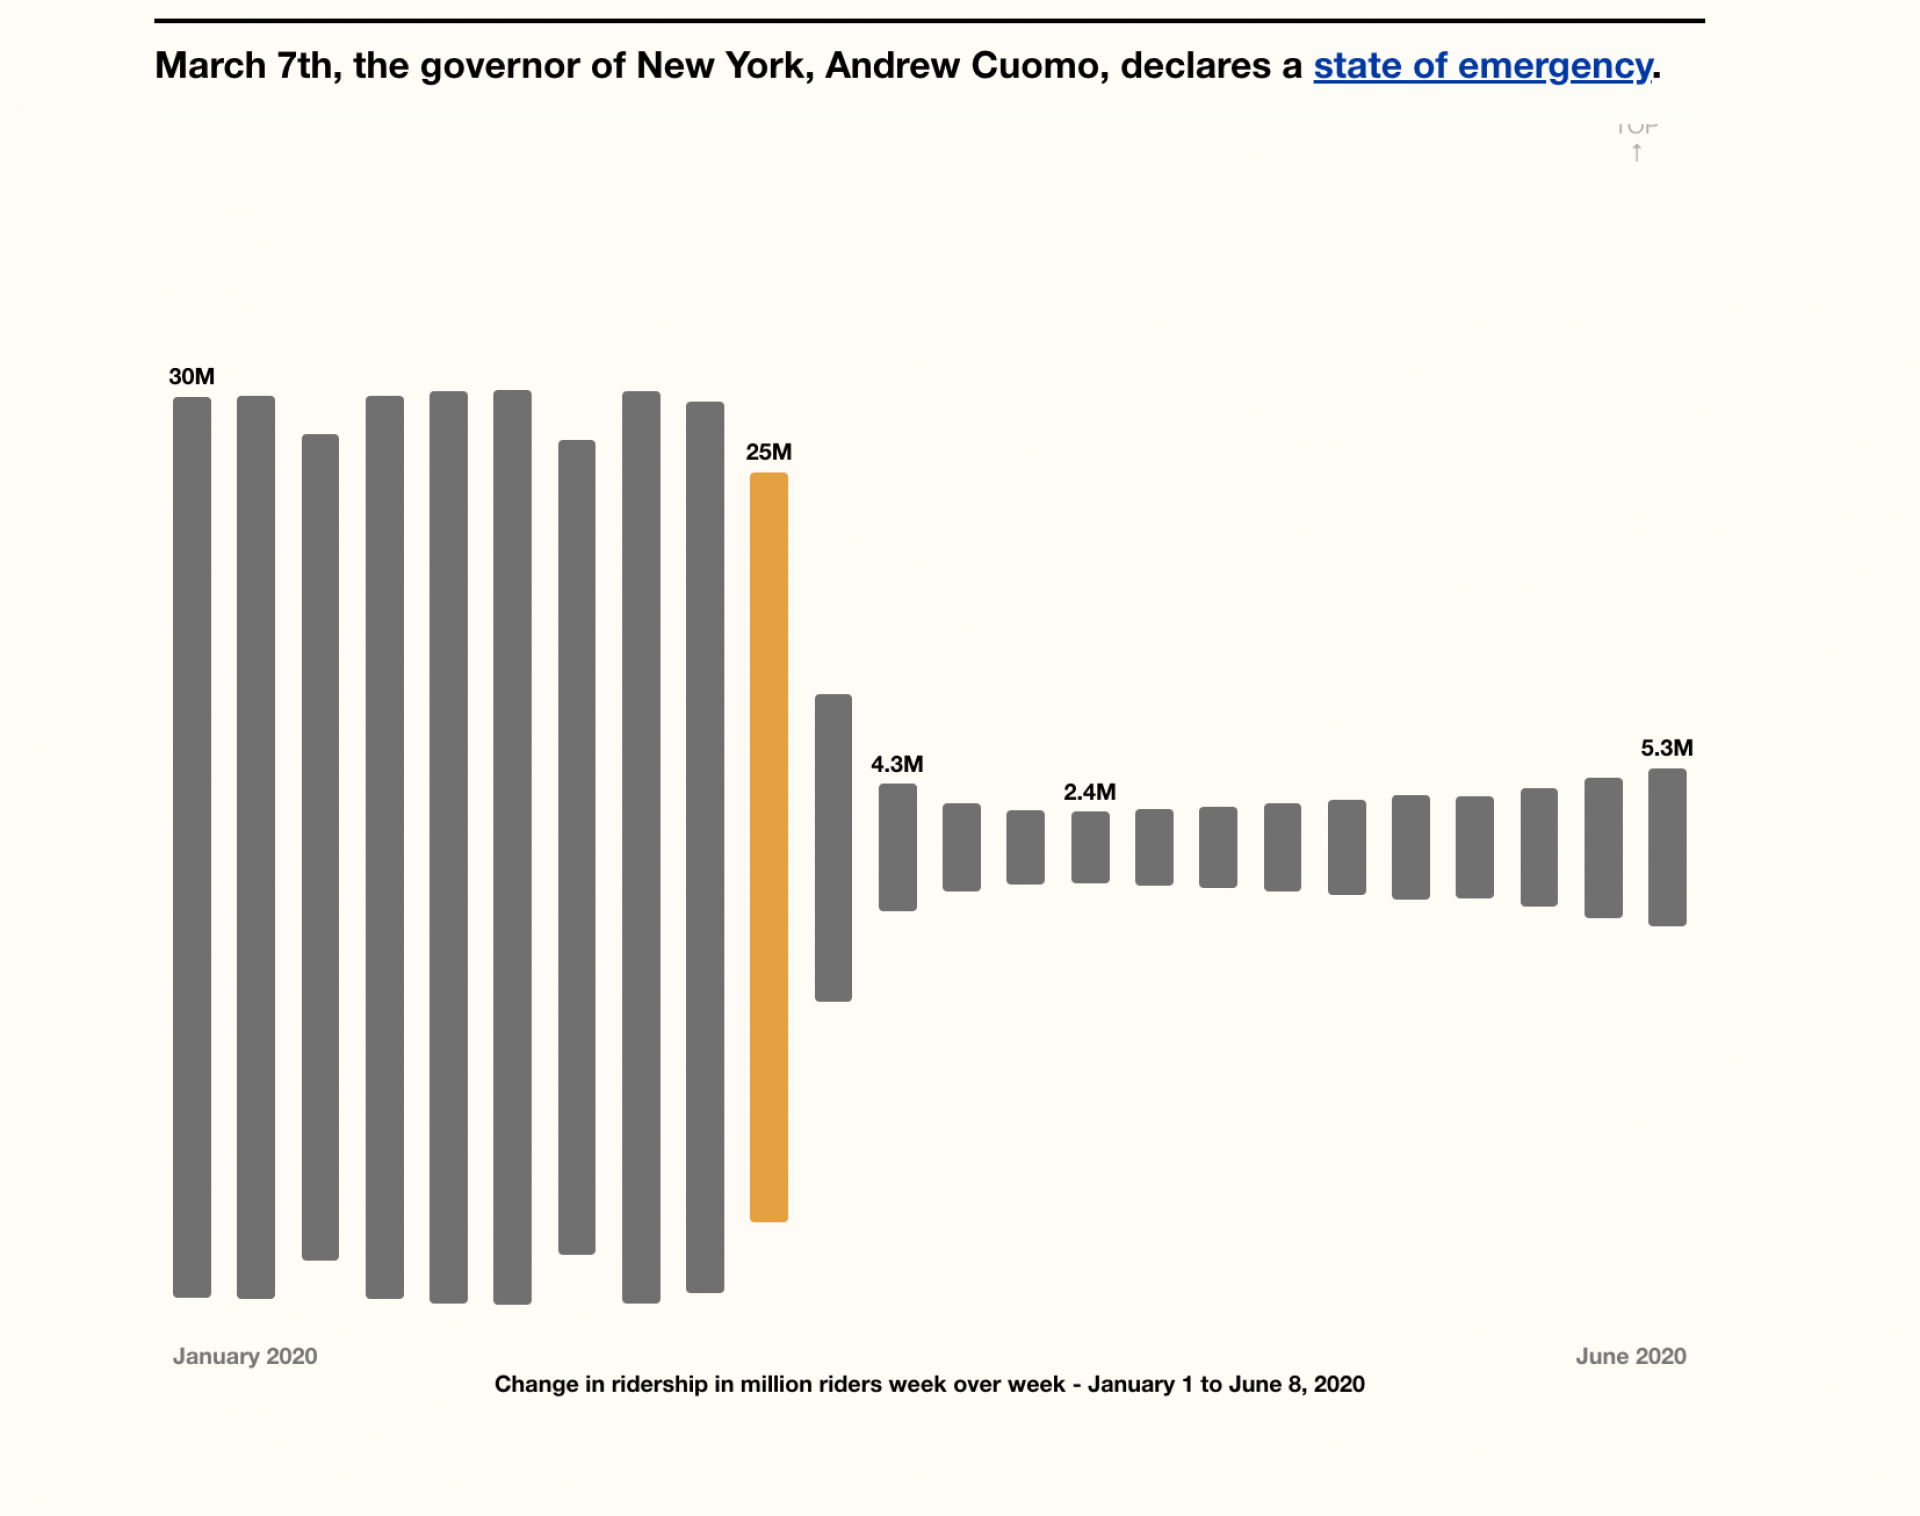
MTA Ridership Changes due to COVID-19 recounts what happened to New York City during the first wave of the coronavirus pandemic. Data visualization agency TWO-N began the project wanting to create a data-driven narrative that would engage New Yorkers and urban data enthusiasts to examine the ways different communities were affected by the unfolding pandemic. The MTA subway system, by being such a ubiquitous vector of mobility throughout the five boroughs, provided a unique lens through which viewers could understand the pandemic’s effects on the city’s populace, especially in terms of privilege and who is most at risk.
Featured Media
Credits

Entrant
Animun Creativity Advanced School
Video / Online Video (Single) - School / University
Country / Region
Spain


Entrant
Pan Am Museum Foundation
Podcast (Single) - New Category (Podcasts - Single)
Country / Region
United States

Entrant
Meticular
Website & Mobile Sites - Non-Profit
Country / Region
United States

Entrant
Forward Networks
Audio & Radio (Single) - Ad Single Spot
Country / Region
United States